AI OS Home energy to grid capacity

Orchestrating the Future of Energy

RenewAI turns solar, battery, EV charging, tariffs, and site alerts into clear savings signals, risk warnings, and next actions for energy operators.

Forecast savings Prioritise risks Recommend actions
5,009+
CONNECTED STATIONS
227kWp
AGGREGATE CAPACITY
45.62MWh
TOTAL GENERATION
100%
AU-EAST SOVEREIGN
renewai.cloud / fleet-intelligence
RenewAI dark-mode fleet command centre showing connected stations, power metrics, map view, and status filters
01 — Why RenewAI

Built around the problems energy teams actually face.

RenewAI starts with the daily friction of sites, partners, alerts, and customer expectations, then turns that operational context into clearer priorities and measurable value.

See real problems / practical priorities / measurable value
Operating pains
RenewAI solves
Disconnected sites and portals Too many alerts, not enough priority Partner and customer pressure Mixed-brand workflows
Built from field experience RenewAI understands the pressure.

It turns real operating pain into clearer priorities and measurable value.

One operating view Priority issues first Savings and risk signals Independent, mixed-brand support
02 — Energy OS

From raw energy signals.To savings, risk clarity, and action.

Energy assets are multiplying. RenewAI helps teams move from raw telemetry to financial signals, predictive warnings, and practical operating decisions.

From raw data to clear next steps
RenewAI Energy OS
01

Analyse

Build a clear picture of where energy, cost, and risk are coming from.

  • Solar, load, battery, and tariff context
  • Site health, alerts, and low-performance signals
  • Weather and usage patterns where available
02

Optimise

Turn the analysis into practical opportunities to reduce cost or improve returns.

  • Improve self-consumption and battery timing
  • Reduce peak-period grid exposure
  • Identify savings and export opportunities
03

Predict

Flag the issues likely to become expensive if nobody acts.

  • Abnormal usage or generation behaviour
  • Fault trends and underperforming sites
  • Weather, tariff, and evening peak exposure
04

Act

Create follow-up actions that match what the platform or user can realistically do.

  • Review savings and risk recommendations
  • Notify, schedule, or create operator tasks
  • Apply supported settings after confirmation
03 — Control Room

See every site, understand every issue, and act with confidence.

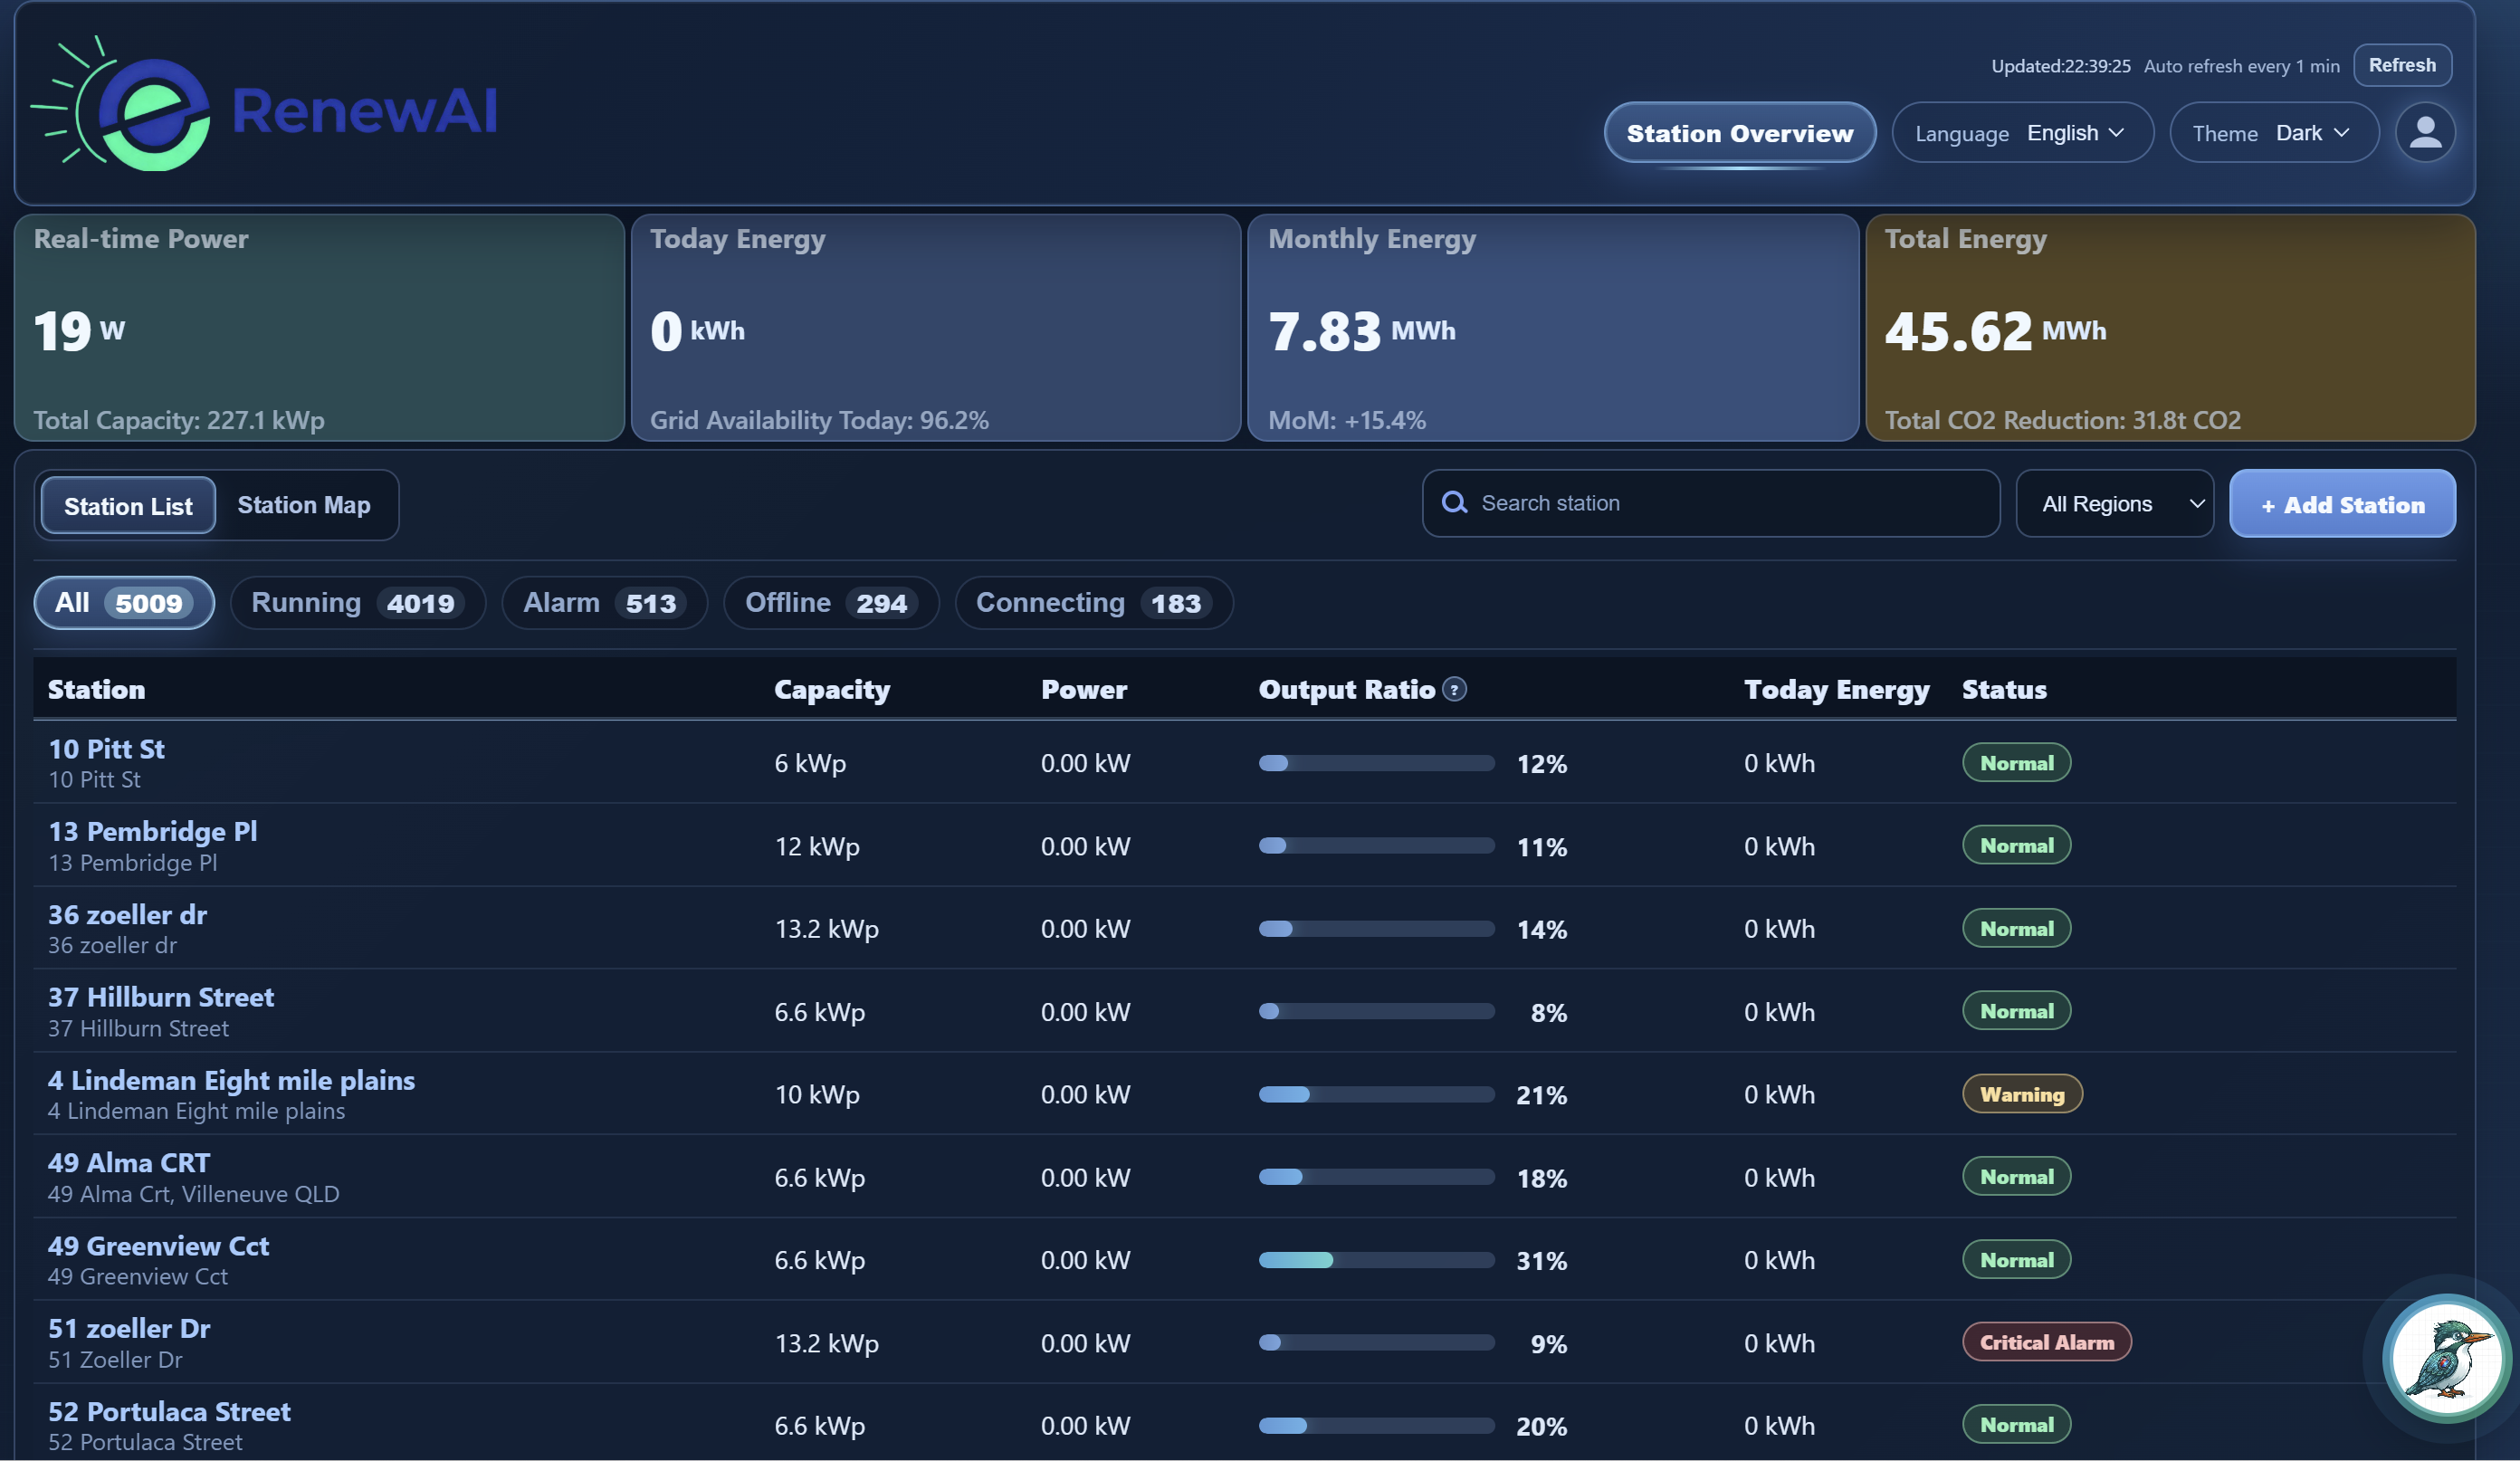
RenewAI Cloud brings fleet status, alerts, regional performance, customer programs, and site intelligence into one control room, so operators can move from overview to root cause without losing context.

Fleet visibility + site intelligence + grid readiness
renewai.cloud / stations
RenewAI dark-mode fleet view — 5,009 connected stations with real-time power, generation, and status segmentation
01

Fleet visibility

Track live power, generation, connectivity, and health across every connected home energy site.

02

Priority operations

Separate normal sites from alerts, communication faults, onboarding issues, and tasks that need attention.

03

Program segmentation

Filter by region, installer, customer cohort, tariff, or commercial program to find the right group fast.

04

Grid readiness

Prepare flexible assets for VPP aggregation, demand response, and future trading workflows.

Control Room / Site Intelligence

From fleet overview to site-level truth.

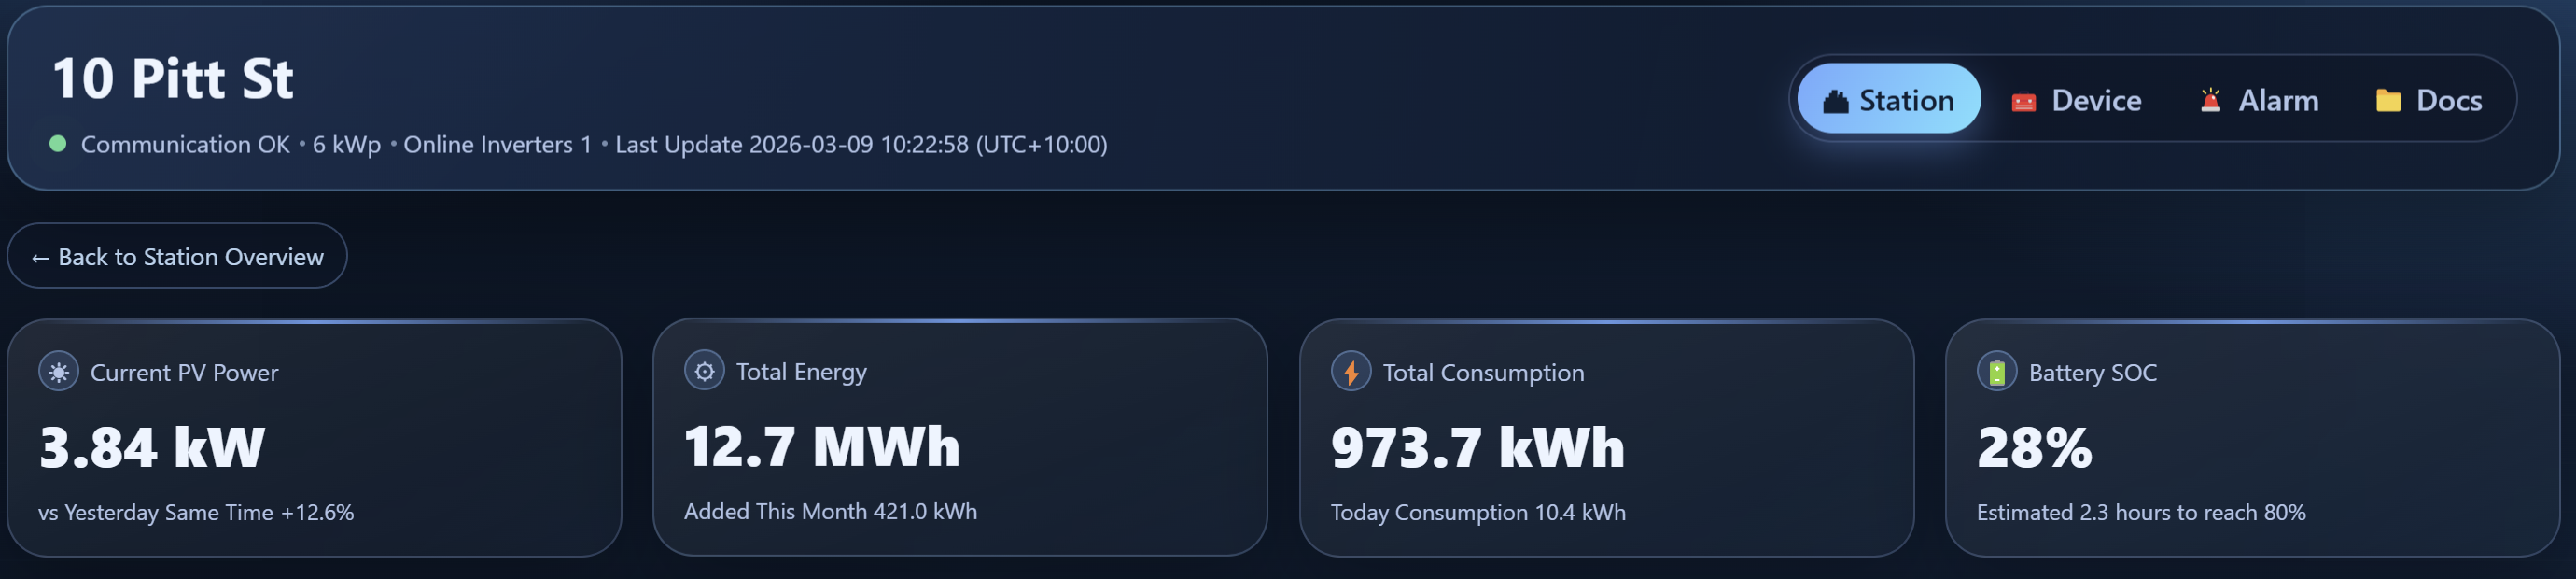
Open any station to understand what is happening now: PV output, load, battery state, consumption, weather context, alarms, and historical performance in one place.

  • Live PV, load, grid, battery SOC, and site health
  • Energy flow, analysis, curves, and statistics
  • Weather, irradiance, tariffs, and operating context
  • Device alarms, event history, and follow-up evidence
renewai.cloud / stations / 10-pitt-st
Single-site detail view - 10 Pitt St - showing PV power, accumulated generation, battery SOC, consumption, and site health

Energy Flow

See how solar, battery, grid, and load are moving so operators can spot unusual behaviour quickly.

Energy analysis cards showing total energy, consumption, today energy, and weather context

Energy Analysis

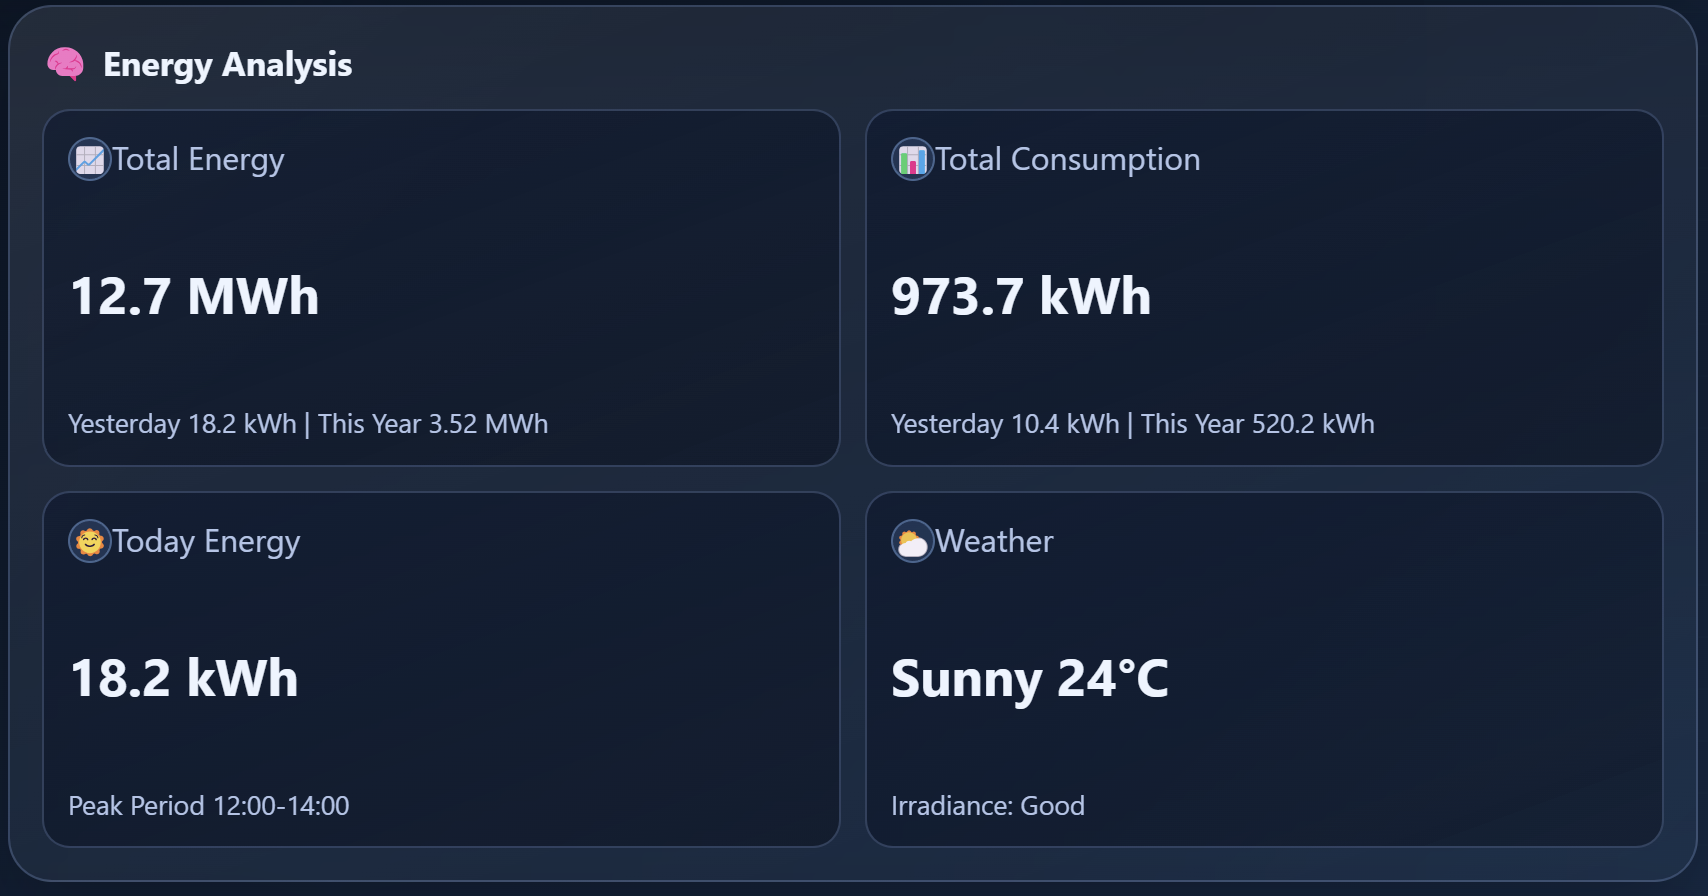
Bring generation, consumption, weather, and peak-period context into one decision snapshot.

Power curve chart comparing generation power, load power, and battery power over time

Power Curve

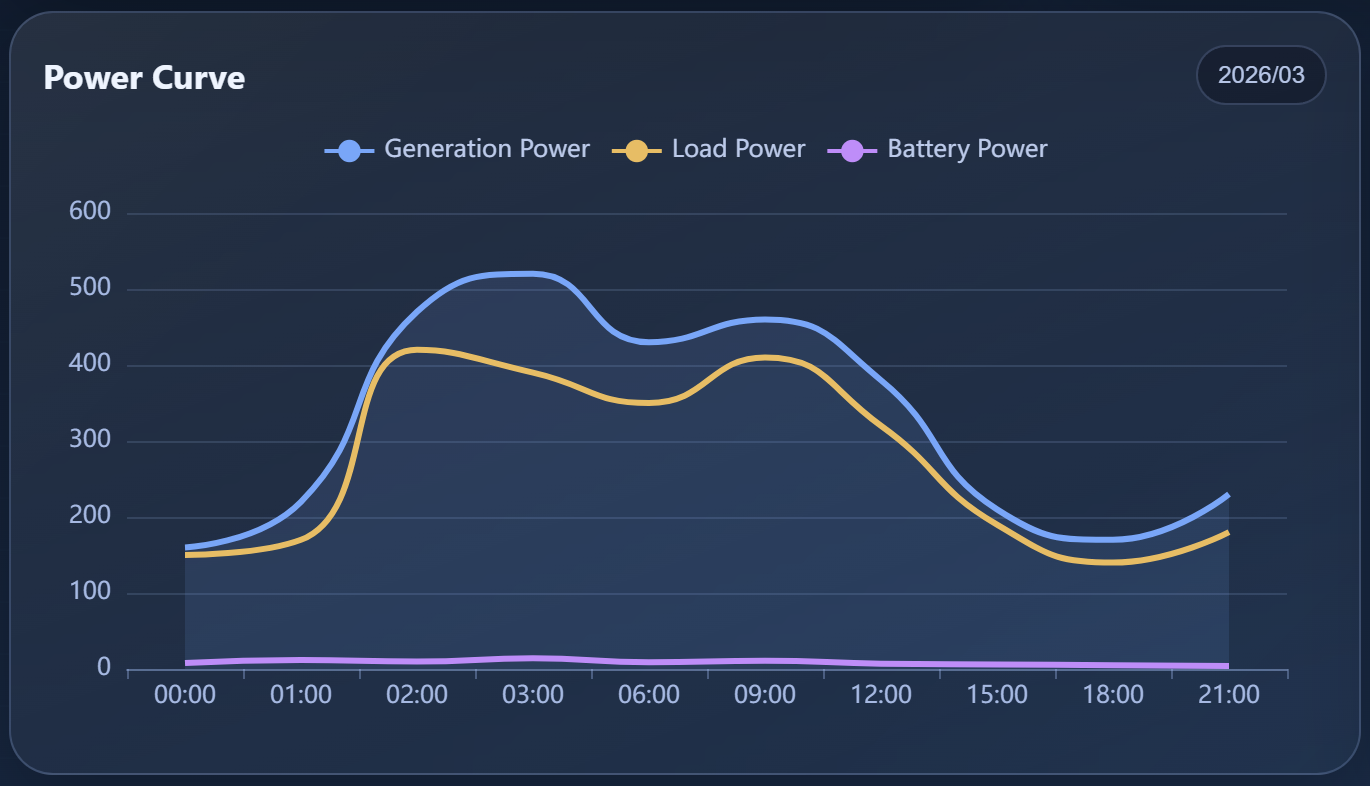
Compare solar output, load demand, and battery behaviour across the day, week, or month.

Energy statistics chart showing daily energy, grid purchase, and consumption bars

Energy Statistics

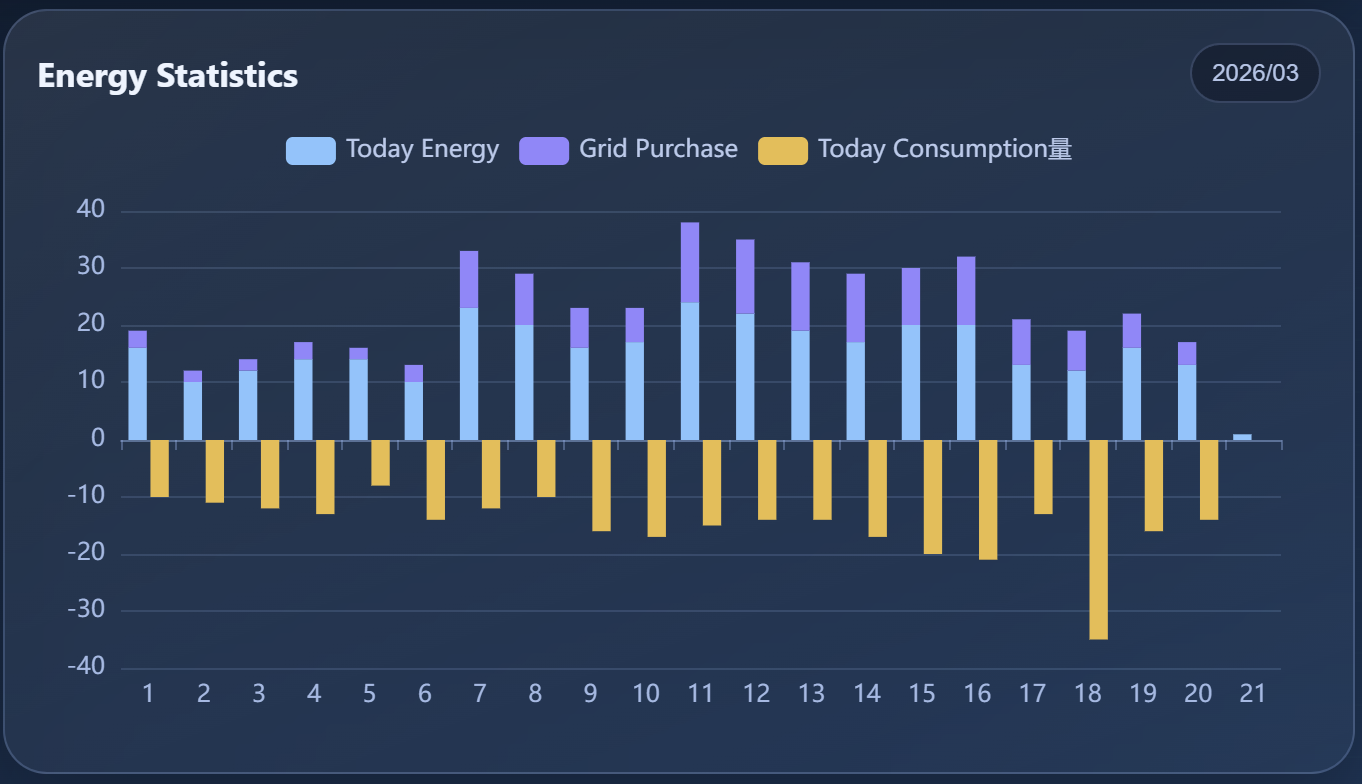
Track production, grid purchase, and consumption trends to explain performance over time.

04 — Hi! Hailey - your AI energy assistant

Ask your energy network anything.

Hailey is RenewAI's built-in AI assistant. Ask in natural language and get site answers, alert summaries, regional comparisons, and operational reports without writing SQL or hunting through dashboards.

Ask the network

Query generation, site status, underperformance, or regional output in plain language.

Prioritise action

Summarise alerts, classify severity, and surface the sites that need attention first.

Explain performance

Compare sites, cohorts, installers, and regions with linked operational context.

Create reports

Create daily and weekly fleet digests for operators, partners, and management.

Why Kookaburra? The Kookaburra is sharp, social, and unmistakably Australian. It reflects an assistant that spots what matters, calls out risks clearly, and helps teams act with confidence.
Market readiness

From control roomto market participation.

RenewAI starts with monitoring because future energy markets depend on assets that are visible, reliable, explainable, and dispatch-ready.

Today

Operators can see connected sites, alerts, generation, load, battery state, and operating health in one place.

Next

AI analysis turns telemetry into risk, savings, availability, and recommended operating actions.

Future

The same trust layer can prepare flexible capacity for VPP, demand response, grid services, and future energy trading workflows.

Visible

Know what each asset can really do.

Market participation starts with confidence in site status, communications, performance, and available capacity.

Explainable

Translate operations into commercial signals.

AI-assisted analysis helps connect energy behaviour with tariffs, risk, weather, customer context, and savings potential.

Flexible

Prepare assets for coordinated action.

Reliable sites can be grouped by region, program, availability, and dispatch value before they are exposed to market workflows.

Ready

Build toward participation, not speculation.

The roadmap is practical: monitor first, optimise next, then support operators as distributed energy becomes tradable capacity.

Operating intelligence becomes market infrastructure. The data layer used to monitor fleets today becomes the confidence layer for future participation.
Roadmap
Contact

Choose RenewAIfor your energy network.

Talk to us about platform pilots, partner integrations, VPP readiness, or how RenewAI can support your next distributed energy program.